What is a Matrix Diagram?
Quality Glossary Definition: Matrix
Also called: matrix, matrix chart
A matrix diagram is defined as a new management planning tool used for analyzing and displaying the relationship between data sets. The matrix diagram shows the relationship between two, three, or four groups of information. It also can give information about the relationship, such as its strength, of the roles played by various individuals or measurements.
Six differently shaped matrices are possible: L, T, Y, X, C, and roof-shaped, depending on how many groups must be compared.
When to Use Each Matrix Diagram Shape
Table 1 summarizes when to use each type of matrix. Click on the links below to see an example of each type. In the examples, matrix axes have been shaded to emphasize the letter that gives each matrix its name.
- An L-shaped matrix relates two groups of items to each other (or one group to itself).
- A T-shaped matrix relates three groups of items: groups B and C are each related to A; groups B and C are not related to each other.
- A Y-shaped matrix relates three groups of items: each group is related to the other two in a circular fashion.
- A C-shaped matrix relates three groups of items all together simultaneously, in 3D.
- An X-shaped matrix relates four groups of items: each group is related to two others in a circular fashion.
- A roof-shaped matrix relates one group of items to itself; it is usually used along with an L- or T-shaped matrix.
Table 1: When to use differently-shaped matrices
|
L-shaped |
2 groups |
A |
|
T-shaped |
3 groups |
B |
|
Y-shaped |
3 groups |
A |
|
C-shaped |
3 groups |
All three simultaneously (3D) |
|
X-shaped |
4 groups |
A |
|
Roof-shaped |
1 group |
A |
L-Shaped Matrix Diagram
This L-shaped matrix summarizes customers’ requirements. The team placed numbers in the boxes to show numerical specifications and used check marks to show choice of packaging. The L-shaped matrix actually forms an upside-down L. This is the most basic and most common matrix format.
L-shaped Matrix Diagram: Customer Requirements
|
|
Customer
D |
Customer
M |
Customer
R |
Customer
T |
|
Purity %
|
> 99.2
|
> 99.2
|
> 99.4
|
> 99.0
|
|
Trace metals (ppm)
|
< 5
|
—
|
< 10
|
< 25
|
|
Water (ppm)
|
< 10
|
< 5
|
< 10
|
—
|
|
Viscosity (cp)
|
20-35
|
20-30
|
10-50
|
15-35
|
|
Color
|
< 10
|
< 10
|
< 15
|
< 10
|
|
Drum
|
|
|
|
|
|
Truck
|
|
|
|
|
| Railcar |
|
|
|
|
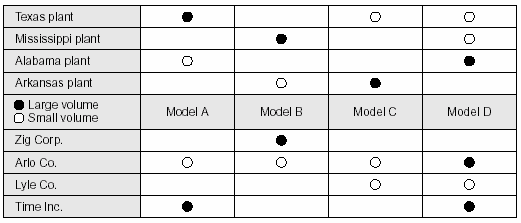
T-Shaped Matrix Diagram
This T-shaped matrix relates product models (group A) to their manufacturing locations (group B) and to their customers (group C).
Examining the matrix (below) in different ways reveals different information. For example, focusing on model A shows that it is produced in large volume at the Texas plant and in small volume at the Alabama plant. Time Inc. is the major customer for model A, while Arlo Co. buys a small amount. Focusing on the customer rows shows that only one customer, Arlo Co., buys all four models. Zig Corp. buys just one. Time Inc. makes large purchases of A and D, while Lyle Co. is a relatively minor customer.
T-shaped Matrix Diagram: Products—Manufacturing Locations—Customers
Y-Shaped Matrix Diagram
This Y-shaped matrix shows the relationships between customer requirements, internal process metrics, and the departments involved. Symbols show the strength of the relationships: primary relationships, such as the manufacturing department’s responsibility for production capacity; secondary relationships, such as the link between product availability and inventory levels; minor relationships, such as the distribution department’s responsibility for order lead time; and no relationship, such as between the purchasing department and on-time delivery.
Y-shaped Matrix Diagram: Responsibilities for Performance to Customer Requirements 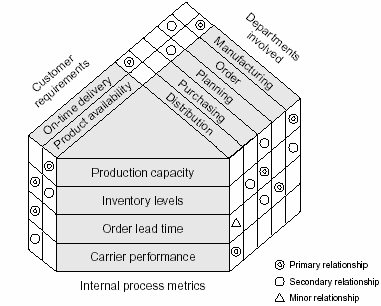
C-Shaped Matrix Diagram
Because this matrix is three-dimensional, it is difficult to draw and infrequently used. If it is important to compare three groups simultaneously, consider using a three-dimensional model or computer software that can provide a clear visual image.
C-shaped Matrix Diagram
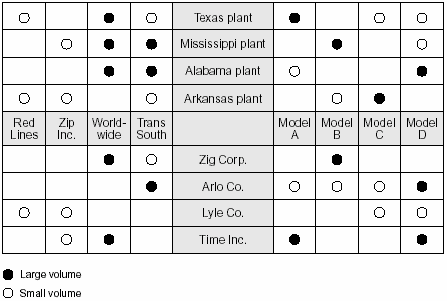
X-Shaped Matrix Diagram
This figure extends the T-shaped matrix example into an X-shaped matrix by including the relationships of freight lines with the manufacturing sites they serve and the customers who use them. Each axis of the matrix is related to the two adjacent ones, but not to the one across. Thus, the product models are related to the plant sites and to the customers, but not to the freight lines.
X-shaped Matrix Diagram: Manufacturing Sites—Products—Customers—Freight Lines
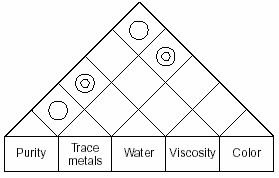
Roof-Shaped Matrix Diagram
The roof-shaped matrix is used with an L- or T-shaped matrix to show one group of items relating to itself. It is most commonly used with a House of Quality, where it forms the "roof" of the "house." In the figure below, the customer requirements are related to one another. For example, a strong relationship links color and trace metals, while viscosity is unrelated to any of the other requirements.
Roof-shaped Matrix Diagram
Frequently Used Matrix Diagram Symbols
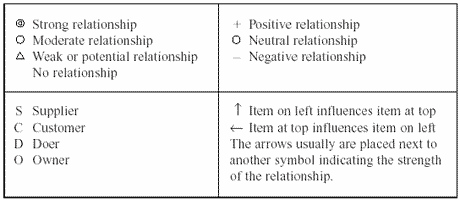
Adapted from The Quality Toolbox, Second Edition, ASQ Quality Press.