Seven Basic Quality Tools
Overview
The seven basic quality tools—also known as the old seven, the first seven, the basic seven, the classic seven, and the seven quality control tools—are simple yet effective and should be included in every quality professional’s toolbox. The tools are:
- Cause and effect diagram (also known as a fishbone diagram or an Ishikawa diagram)
- Check sheet
- Control chart (also known as a Shewhart chart)
- Histogram
- Pareto chart
- Scatter diagram
- Stratification or Flowchart or Run chart
While classic tool lists include stratification, more current views typically include flowchart and leave off stratification. In some instances, run chart may also be included as one of the seven basic tools.

WHAT ARE THE SEVEN BASIC QUALITY TOOLS?
The seven basic quality tools were first highlighted in Kaoru Ishikawa’s classic book Guide to Quality Control. And new classics, like Nancy Tague’s The Quality Toolbox also references these tools. When used appropriately, each tool can have a major impact on your quality improvement activities. Using these tools in combination further multiplies their value.
- Cause and effect diagram: Also known as an Ishikawa diagram or a fishbone diagram, this tool analyzes process dispersion. It illustrates the main causes and subcauses leading to an effect.
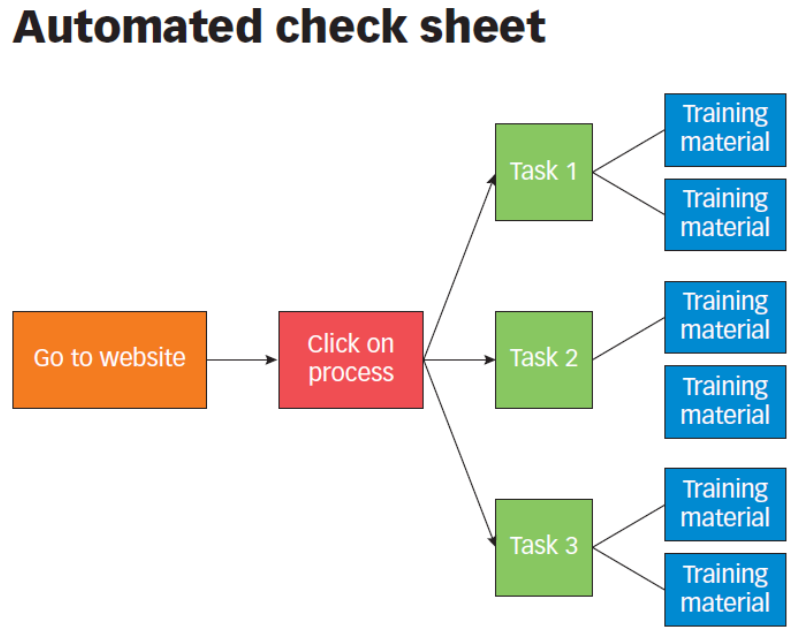
- Check sheet: Not to be confused with checklists, a check sheet is a simple data recording tool. It consists of a list of problems and the number of occurrences indicated by tally marks.
- Control chart: This is a time sequenced chart with upper and lower control limits on which values of some statistical measure for a series of samples or subgroups are plotted. Often, the chart shows a central line to help detect a trend of plotted values toward either control limit. Control charts are used to study how a process changes over time and whether a process is consistent or in control, or unpredictable and out of control.
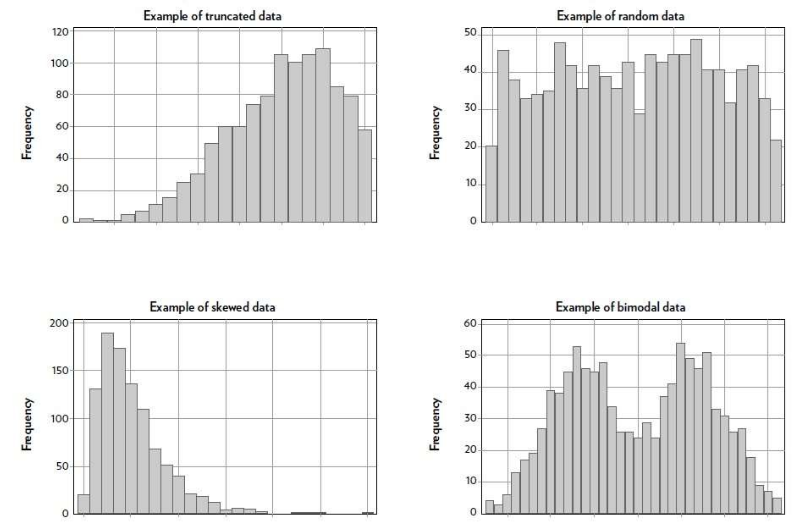
- Histogram: A histogram is used for displaying the distribution of data graphically. The pictorial nature of a histogram helps people more easily identify patterns that are difficult to detect in a table of numbers, as well as understand the frequency of distributions.
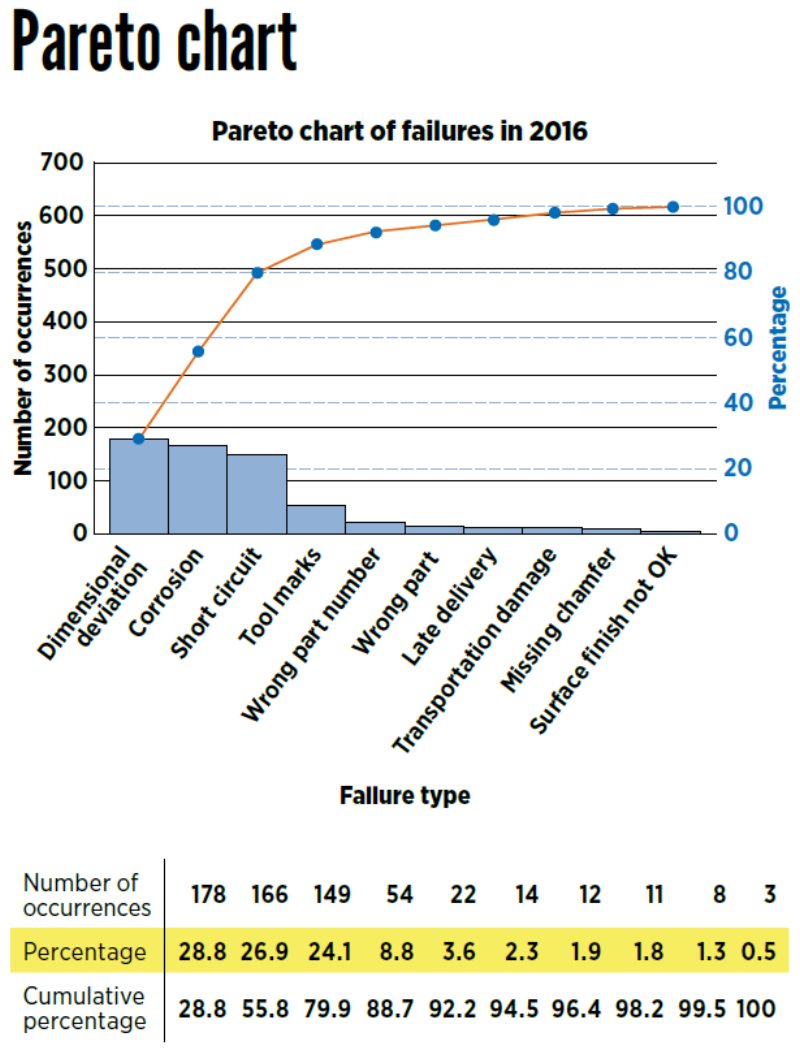
- Pareto chart: Based on the Pareto principle or 80/20 rule—which states that 80% of outcomes result from 20% of causes—this chart graphically displays the relative importance of differences among groups of data within a set, from most to least significant.
- Scatter plot or diagram: A scatter plot is a simple visual form of graphical analysis used to analyze and identify potential relationships between two variables plotted along the x-axis and y-axis.
- Stratification: Stratification refers to breaking down data into categories to more easily make sense of them.
TOOL TEMPLATES AND HOW TO USE DOCUMENTATION
The following templates will help you master the application of these foundational tools. When possible, a link to how-to-use documentation also is included.
Cause and effect diagram
Check sheetControl chart
Histogram
Pareto chart
Scatter diagram
Stratification
A CLOSER LOOK AT FLOWCHARTS AND RUN CHARTS
Depending on what list you look at, some include flowchart or run chart instead of stratification.
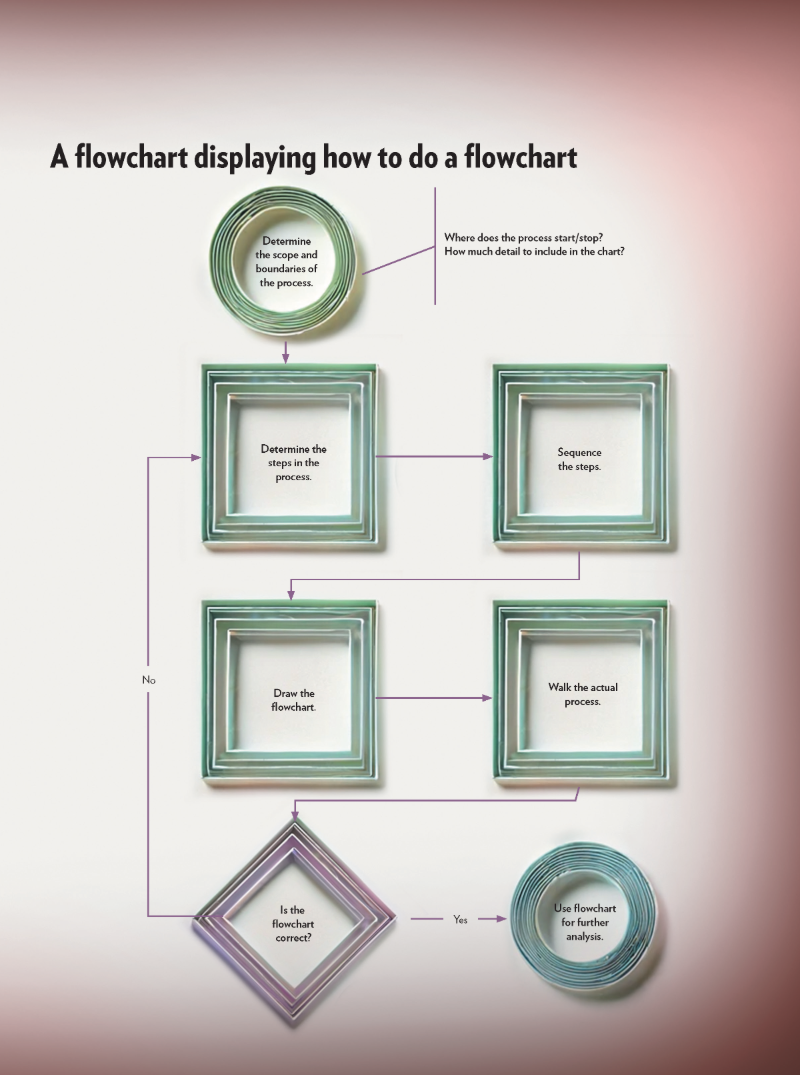
A common type of process map, a flowchart is a graphical representation of the steps in a process
A run chart shows a line connecting many data points collected from a process running over time. Run charts can be used to look for outliers, when they happened, and potential changes in process performance or trends
Related Video
The Essential Quality Tools Series
In this introduction to one of ASQ's most popular series of webcasts, Dr. Jack ReVelle provides a brief description and example of each of the seven basic quality control tools.
Community
myASQ’s online communities provide expanded networking and learning opportunities, including blog posts, discussion threads, and library entries on topics like the fishbone diagram. Members can create new communities to generate new discussions and connections, and anyone can join online communities to reach a broader audience of quality professionals and practitioners – anytime, anywhere.

Certifications
ASQ offers 19 different certifications ranging from foundational quality to advanced quality management, including five ANSI ANAB ISO 17024 accredited programs. Earning an ASQ Certification provides you an opportunity to learn quality tools & concepts and gain a credential that can increase your earning potential and help grow your career.
Learn more about ASQ Certification
View Certification Preparation Resources (Virtual Courses, E-Learning, Question Banks, & Handbooks)

Reviewers
Douglas C. Wood has over 40 years in the areas of cost of quality, office waste, root cause analysis, performance measurement. He holds a master’s degree in industrial management from the University of Central Missouri in Warrensburg. An ASQ senior member, Wood also is an ASQ certified manager of quality/organizational excellence, quality auditor, quality engineer, Six Sigma Black Belt and process analyst. He is co-author of The ASQ Certified Manager of Quality/Organizational Excellence Handbook, 5th ed. Find him on LinkedIn: www.linkedin.com/in/douglascwood/
Reviewed December 2024.
References
Don Arp Jr., Gary G. Jing, Katie Labedz, Stephanie Parker, and W. Frazier Pruitt, "Tool Talk," Quality Progress, August 2024, pp. 12-25.
Matthew Barsalou, "Statistics Spotlight: Grasp These Graphs," Quality Progress, April 2024, pp. 46-49.
Matthew Barsalou, "Statistics Spotlight: Revisiting the Old Seven," Quality Progress, April 2017, pp. 42-45.
James L. Bossert, Grace L. Duffy, R. Dan Reid, James J. Rooney, "Speaking Your Language," Quality Progress, August 2018, pp. 15-37.
James J. Rooney, T.M. Kubiak, Russ Westcott, R. Dan Reid, Keith Wagoner, Peter E. Pylipow, Paul Plsek, "Building From the Basics," Quality Progress, January 2009, pp. 18-29.
Nancy R. Tague, The Quality Toolbox, 3rd ed., Quality Press, 2024.
Reprints & Permissions
ASQ gladly considers requests to use its intellectual property, please see the ASQ reprint permission page for more information. For use of ASQE content or graphics, please contact us at [email protected] to request permission.
Join Us on Social
Network with the world’s largest community of quality professionals.

