Fishbone
Overview
A fishbone diagram, sometimes referred to as a cause-and-effect diagram or an Ishikawa diagram, is a quality tool that helps users identify the many possible causes for a problem by sorting ideas into useful categories.

WHAT IS A FISHBONE DIAGRAM?
A fishbone diagram is one of the most widely used tools in quality management and is considered one of the Seven basic quality tools. Also known as a cause and effect diagram or an Ishikawa diagram (after its creator, Kaoru Ishikawa), the fishbone diagram can help users identify the many possible causes for a problem by sorting ideas into useful categories and is especially useful in structuring brainstorming sessions. It is called a fishbone diagram because when completed, the chart is shaped like a fish skeleton.
The fishbone diagram has variations with nuanced procedures and outcomes, including:
- Cause enumeration diagram
- Process fishbone
- Cause and effect diagram with the addition of cards (CEDAC)
- Desired-result fishbone
- Reverse fishbone diagram
In smaller projects or when immediate action is needed, the fishbone diagram may be the only tool used to determine the root cause(s) of a problem and guide actions. For complex problems, however, it may be one of several tools used in the improvement process alongside others like a responsibility matrix or an action-planning matrix.
FISHBONE DIAGRAM PROCEDURE
To create a basic fishbone diagram, you will need something large to write on, like a flipchart or whiteboard. You also will need a group of individuals who possess the necessary knowledge about the area being analyzed.
- Agree on the problem statement or effect being analyzed. For example, determining why there have been frequent defects in a series of pumps delivered to a customer.
- Draw a horizontal, right-facing arrow in the center of the page—this will be the fish’s spine. At the end of the arrow, like the fish’s head, write the problem statement (e.g., frequent pump defects) and draw a box around it.
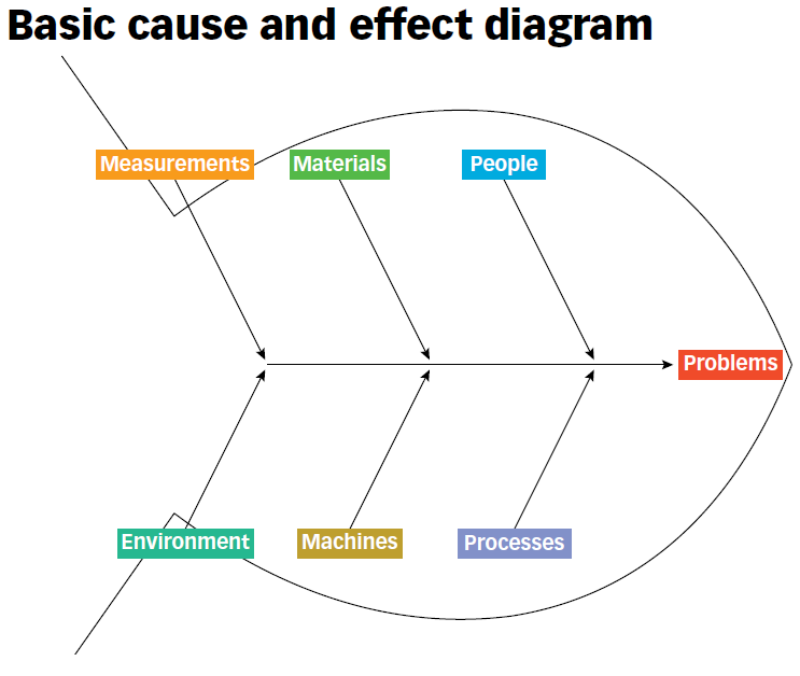
- Identify the main categories of the problem’s causes and draw these as branches emanating from the central arrow, like a fish’s ribs. Ishikawa introduced the “6 M’s” as generic labels to describe the core categories, but he also encouraged creativity in naming these categories to communicate more clearly to those who would be using the diagram. The 6M’s stand for:
- Materials—parts, ingredients, supplies
- Machinery —production-related equipment, materials handling equipment, software (this may need to be a separate category for some industries/organizations)
- Methods —procedures, techniques, processes, regulations (this may need to be a separate category for government and heavily regulated industries)
- Measurement—key indicators, measurement devices, key data capture or collection points
- Manpower—people and human resources, with their associated training, skills, competences
- Mother Nature —environment and externalities
- Less commonly included but useful for contemporary diagrams is a seventh M: Money —operating expenses and capital investments
- Using the main categories as a guide, ask "Why does this happen?" to help brainstorm all possible causes of the problem, aiming for brief and succinct descriptions. As each idea is given, the facilitator writes it as a branch from the appropriate category. Causes can be written in several places if they relate to several categories.
- Continue asking "Why?" to generate deeper levels of causes, writing subcauses as branches off the causes. Layers of branches indicate causal relationships.
- When the group runs out of ideas, focus on the places where there are fewer ideas.
- Analyze the identified causes to determine those that should be addressed further. Remember that the purpose is to cure the problem, not the symptoms. It may be necessary to redraw the fishbone diagram after the first version has been completed to keep things clear and organized for analysis.
- If needed, follow up with additional tools like a responsibility matrix, which identifies who has ownership over the cause as well as how much control that person has over eliminating or reducing the effects of the cause.
Start creating your own fishbone diagram using this complimentary downloadable template as a guide for your larger-scale diagram.

FISHBONE DIAGRAM EXAMPLE—SIMPLE
In this example, a grocery store has been receiving customer complaints regarding trouble holding the store’s paper bags, with customers reporting that they often drop the bags and the contents within break. A team is gathered to brainstorm the root cause(s) of this problem to address this voice of the customer feedback.
The team agrees on the problem statement “Customers can’t carry bags” and one rib is labelled “Equipment.” It is discovered that the store used to have bags with handles but recently switched to non-handled bags to save money. Depending on the other causes, the store can decide whether reinstituting handled bags might fix the problem, especially if the store is losing customers or paying for broken items, or if staff requires training to reduce bag loads given the lack of handles.

FISHBONE DIAGRAM EXAMPLE—COMPLEX
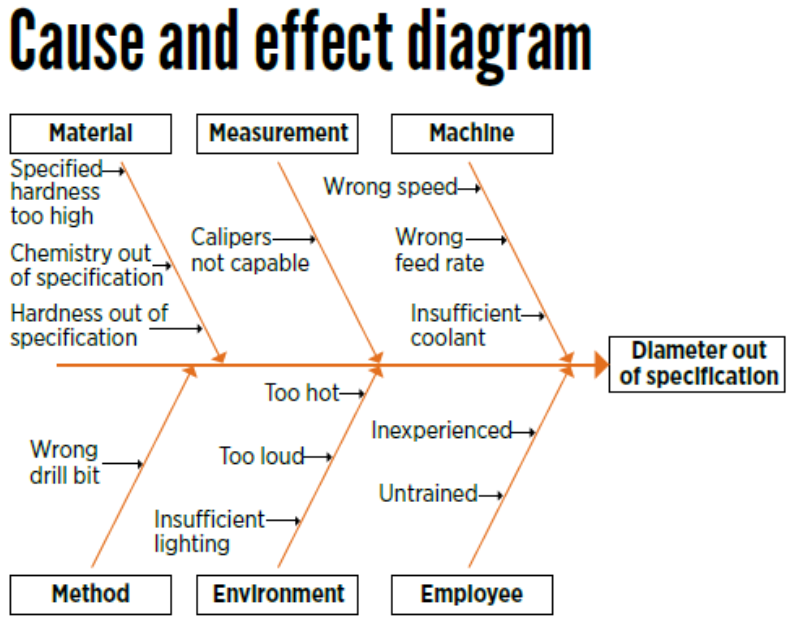
In this example, a manufacturing team is trying to understand the source of periodic iron contamination in one of its products. After gathering a team that has firsthand knowledge of the processes involved in manufacturing the contaminated product, the team used the main categories of fishbone analysis to prompt and categorize ideas.
Layers of branches show thorough thinking about the causes of the problem. Under the main category "Machines," for example, the cause "Materials of construction" shows four kinds of equipment as subcauses—exchangers, reactors, pumps, and pipes—as well as several specific machine numbers.
Note that some ideas appear in multiple places. "Calibration," for example, is listed under the main category "Methods" as a factor in the analytical procedure and under "Measurement" as a cause of lab error. Additionally, "Iron tools" can be considered a "Methods" problem when taking samples and a "Manpower" problem with maintenance personnel.
The resulting fishbone diagram reveals that the process is quite complex, so the team determines that additional information and data are needed to improve the process and eliminate the contamination. One course of action could be to investigate the frequency of lab errors using a check sheet to collect and analyze data on this cause to see whether any patterns are revealed.

Related Podcast
A Fishbone Diagram for Digital Transformation
Discover a powerful revamp of the traditional fishbone diagram for digital transformation.
Community
myASQ’s online communities provide expanded networking and learning opportunities, including blog posts, discussion threads, and library entries on topics like the fishbone diagram. Members can create new communities to generate new discussions and connections, and anyone can join online communities to reach a broader audience of quality professionals and practitioners – anytime, anywhere.
Certifications
ASQ offers 19 different certifications ranging from foundational quality to advanced quality management, including five ANSI ANAB ISO 17024 accredited programs. Earning an ASQ Certification provides you an opportunity to learn quality tools & concepts and gain a credential that can increase your earning potential and help grow your career.
Learn more about ASQ Certification
View Certification Preparation Resources (Virtual Courses, E-Learning, Question Banks, & Handbooks)

Reviewers
Matthew Barsalou works in the automotive industry in Germany. He has a master’s degree in business administration and engineering from Wilhelm Büchner Hochschule, and a master’s degree in liberal studies from Fort Hays State University in Hays, KS. Barsalou is an academician in the International Academy for Quality, an ASQ fellow and the past-chair of ASQ’s Statistics Division. He is certified as a lean Six Sigma Master Black Belt and an ASQ-certified Six Sigma Black Belt, manager of quality/organizational excellence, quality technician and quality engineer.
Reviewed October 2024.
References
Bjørn Andersen, Business Process Improvement Toolbox 2nd ed., Quality Press, 2007.
Don Arp Jr., Gary G. Jing, Katie Labedz, Stephanie Parker, and W. Frazier Pruitt, "Tool Talk," Quality Progress, August 2024, pp. 12-25.
Matthew Barsalou, "Statistics Spotlight: Revisiting the Old Seven," Quality Progress, April 2017, pp. 42-45.
Kimball Bullington, “Learning to Fish,” Quality Progress, July 2012, pp. 16-21.
James J. Rooney, T.M. Kubiak, Russ Westcott, R. Dan Reid, Keith Wagoner, Peter E. Pylipow, Paul Plsek, "Building From The Basics," Quality Progress, January 2009, pp. 18-29.
Nancy R. Tague, The Quality Toolbox, 3rd ed., Quality Press, 2024.
Gregory H. Watson and Ekaterina A. Spiridonova, “Fish(Bone) Stories: Reimagining the Fishbone Diagram for the Digital World,” Quality Progress, August 2019, pp. 15-23.
Reprints & Permissions
ASQ gladly considers requests to use its intellectual property, please see the ASQ reprint permission page for more information. For use of ASQE graphics or content, please contact [email protected] to request permission.
Join Us on Social
Network with the world’s largest community of quality professionals.

